
Significant difference testing for three or more types of data is not supported by Excel functions. While the statistical software R is a free means to perform this, it takes time until you can use it proficiently.
This site provides a tool to easily perform significant difference tests by entering necessary items into a template and copy-pasting them into R.
The supported Excel data formats are as follows.
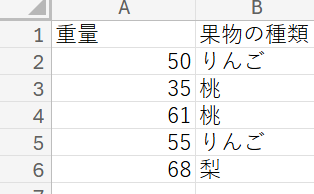
It determines if there is a significant difference in the average value of numerical data for each category. In the following data, it determines the significant difference in the average weight for each type of fruit.
・Change working directory
Please refer to here (opens in a new tab) to change your current directory to the folder where the Excel file you want to use is located.
・Select how to specify the Excel sheet to read
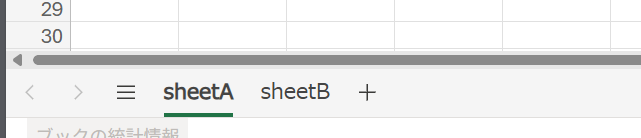
Let’s explain using the Excel file above as an example. By default, the first sheet, sheetA, is read.
If you want to read the second or subsequent sheets, you need to change the sheet specification method.
When reading sheetB, enter sheetB in the blank for the sheet name if using the name specification method. If specifying by number, enter the position of the sheet in the blank. Since sheetB is the second sheet, enter 2.
・Input Excel information and Copy-Paste
After entering the Excel file name etc. in the blanks below, press the copy button to copy the code. Paste it after the > in R and press Enter to execute it.
library(openxlsx);
data = read.xlsx(".xlsx")
2 Entering Excel Data Headers
Press the set button after entering the information in the blanks below. The input values will be reflected in the templates for the following steps.Enter the header name of the numerical data as it appears in the Excel file (e.g., Weight in the photo) in the data header blank. Enter the category name for the numerical data (e.g., Fruit type in the photo) in the group header blank.
3 Test of Homogeneity of Variances (Bartlett test)
Select a significant difference test method based on your data to get more accurate results. Determine the testing method for step 5 based on the results of this step 3 and the following step 4. If the header and group names are set in step 2, copy-paste to R just like in step 1.Below is an example of the R result. If this p-value is greater than 0.05, the data is homoscedastic.
Bartlett test of homogeneity of variances

data:  data$e068 by data$shoriku
Bartlett's K-squared = 10.579, df = 3, p-value = 0.01424
4 Normality Test
Execute this in R as you did in step 3. Similarly, if the p-value is greater than 0.05, the data is normally distributed.library(onewaytest);
nor.test( ~ , data = data)
5 Significant Difference Test
From steps 3 and 4, you have determined whether the data has equal variance and whether it follows a normal distribution. Based on this, select a test method and execute it in R.library(lawstat);
brunner.munzel.test(data$, data$)
                diff        lwr       upr     p adj
りんご-桃 -0.01373369 -0.3023816 0.2749142 0.9911629
もも-梨    0.50300842  0.2143605 0.7916564 0.0015031
梨 -りんご 0.51674212  0.2280942 0.8053901 0.0012126
You should get results like the above. If this p adj value is smaller than 0.05, it is determined that there is a significant difference. In the above, there are no significant differences between the weights of Peach and Pear, and Pear and Apple respectively, but there is a significant difference between the weights of Apple and Peach.
コメント